You can add a reference line to any continuous axis.
To add a reference line:
-
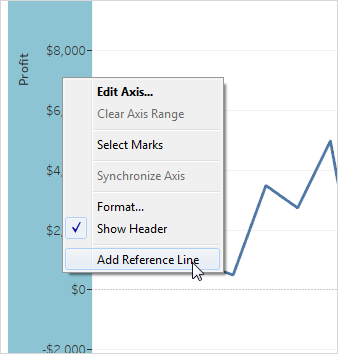
Right-click on a quantitative axis and select Add Reference
Line, Band, or Box.
-
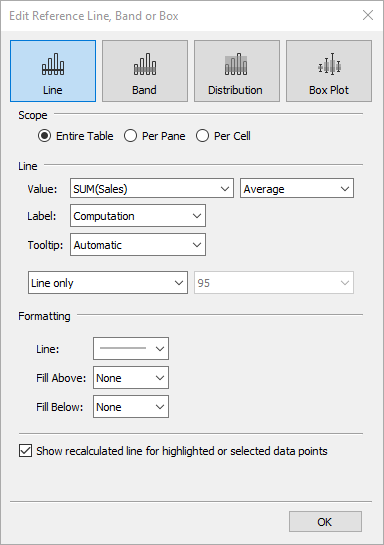
In the Add Reference Line, Band, or Box dialog box, select Line.
-
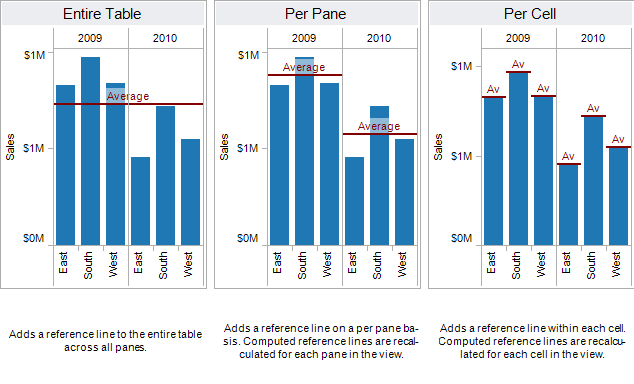
In the Add Reference Line, Band, or Box dialog box, select one of the following
scopes:
-
Select a measure from the Value field to use as
the basis for your reference line. You can also select an existing
parameter, or create a new parameter on the fly.
You cannot select a measure that isn't currently in the view as the basis for your reference line. If this is what you want to use, close the Add Reference Line, Band, or Box dialog box and then drag the measure you want to use from the Data window to the Details target on the Marks card and change the aggregation if necessary. This will not change the view, but it will allow you to use that measure as the basis for your reference line. Now re-open the Add Reference Line, Band, or Box dialog box and resume at step 1, above. -
Select one of the following aggregations:
-
Average - places a line
at the average value along the axis.
-
Constant- places a line at the specified value on
the axis.
-
Maximum - places a line at the maximum value.
-
Median- places a line at the median value.
-
Minimum - places a line at the minimum value.
-
Sum - places a line at the SUM of all the values in
either the cell, pane, or entire view.
-
Total - places a line at the aggregate of all the
values in either the cell, pane, or the entire view. This option
is particularly useful when computing a weighted average rather
than an average of averages. It is also useful when working with
a calculation with a custom aggregation. The total is computed using
the underlying data and behaves the same as selecting one of the
totals option the Analysis menu.

-
Average - places a line
at the average value along the axis.
-
Select how you want to label the line. You can select from
the following options:
-
None –select this option
to not include a label for the reference line.
-
Value – select this option to include a label that
is the corresponding value on the axis.
-
Computation – select this option to display an automatic
label. The label is based on the computation and the measure that
is selected.
-
Custom – select this option to type a custom label
into the text box. You can use the menu to the right of the text
box to insert values such as the computation or the value.
-
None –select this option
to not include a label for the reference line.
-
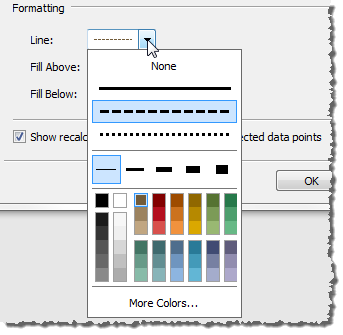
Specify Formatting options for the line. You can change the
style, thickness, and color.
-
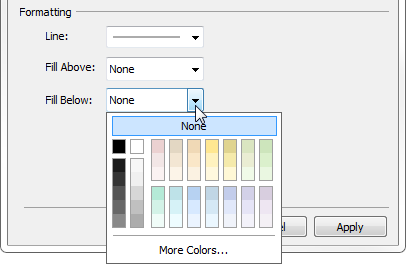
Optionally, add a Fill color Above and Below the
line.
I have read your blog its very attractive and impressive. I like your blog salesforce Online Training
ReplyDeleteThis comment has been removed by the author.
ReplyDeleteHi there! It is a very interesting blog on Tableau Training topic. I was surfing through the internet for Tableau interview questions and came across your blog. You definitely have a good understanding of the topic. What do you think about these Tableau interview questions.
ReplyDeleteHi, I read your whole blog. This is very nice. Good to know about the Tableau and is very demanding in future. We are also providing various Tableau Training & Certification Courses, anyone interested can Tableau certification for making their career in this field.
ReplyDelete