In Tableau, multidimensional data sources are supported only in Windows.
You can think of a calculation filter as “slicing” the
cube’s data through the specified dimensions. Therefore, a calculation
filter for a multidimensional data source is sometimes referred
to as a slicer. Because the aggregation for this arbitrary slice was not defined when the cube was created, Tableau automatically performs a summation. Fortunately, measures are usually aggregated as a summation. Therefore, applying a calculation filter produces a sum of a group of sums, which is a calculation that is useful and easy to interpret.
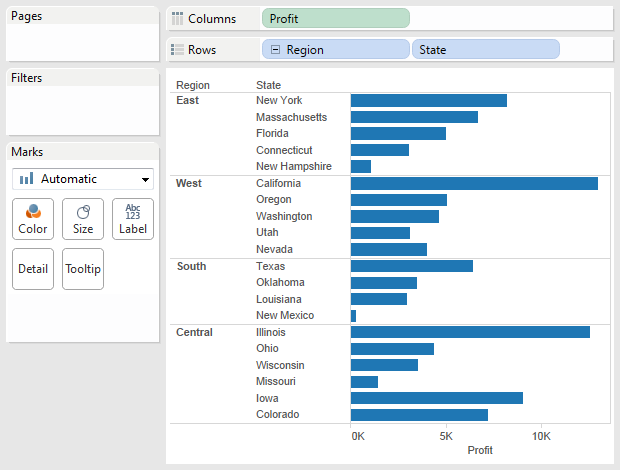
For example, consider the view shown below, which shows profit by region and state.
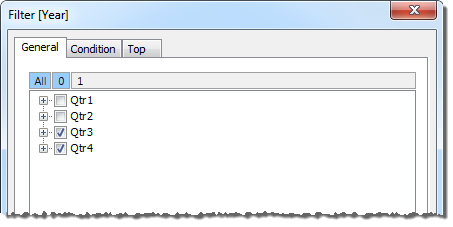
An external filter that consists of the Q3 and Q4 members of the Quarter dimension is applied to the data.
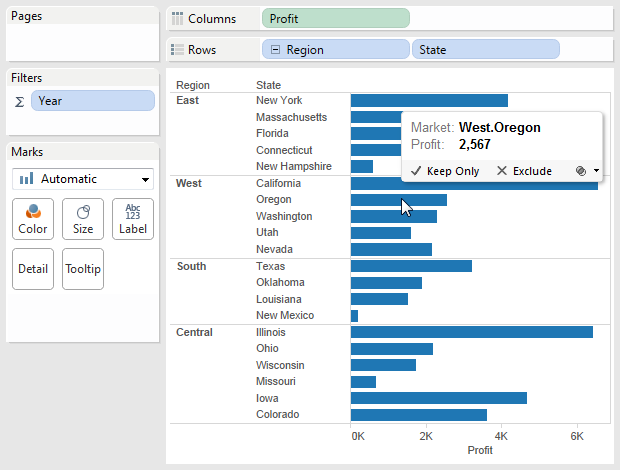
For example, tin the view below the profit for Oregon is now $2,567. This number was calculated by summing the data for Qtr3 and Qtr4.
This comment has been removed by the author.
ReplyDeleteI really liked your blog post.Much thanks again. Awesome.
ReplyDeletedata science training india
data science course hyderabad online
Hi, I read your whole blog. This is very nice. Good to know about the career in Tableau Training & Certification. We are also providing various Tableau Training , anyone interested can Tableau Training for making their career in this field .
ReplyDelete