Tableau offers four types of reference lines, bands, and boxes:
-
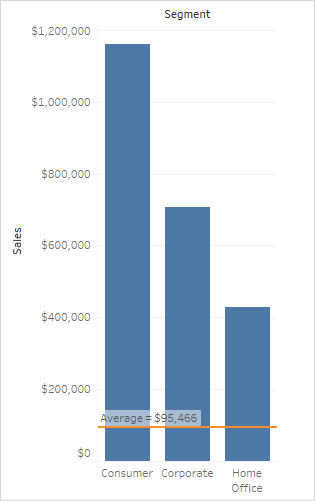
Line - adds a line at a constant or computed value
on the axis. Computed values can be based on a specified field.

-
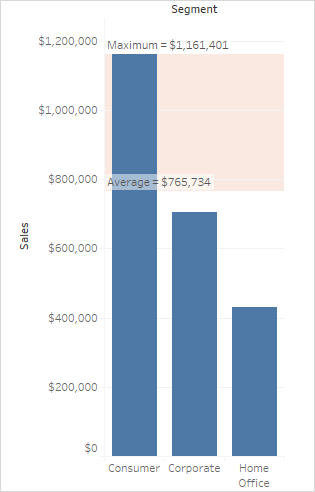
Band - shades an area behind the marks in the view
between two constants or computed values on the axis.

-
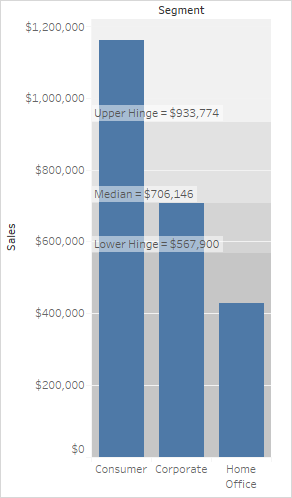
Distribution - adds a gradient of shading to indicate
the distribution of values along the axis. Distribution can be defined
by confidence intervals, percentages, percentiles, quantiles, or
standard deviation. In addition to the shading, you can add a line
to mark a constant or computed value along the axis. This type of
reference can be used to create bullet charts.

-
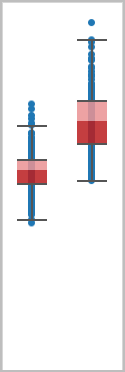
Box Plot - adds a
box plot that describes the distribution of values along the axis. Box
plots show quartiles and whiskers. Tableau provides different box plot
styles, and allows you to configure the location of the whiskers and
other details. See Adding Box Plots.

This blog gives very important info about bi Tools Thanks for sharing, learn more about BI Tools like
ReplyDeleteTableau Online Course