Working with dates in Tableau differs
depending on whether you are using a Relational or Multidimensional
Data Source. This section below discusses these differences.
Dates in Multidimensional Data Sources
In Tableau, multidimensional data sources are supported only in Windows.
For multidimensional data sources, dates
dimensions are usually organized into hierarchies that contain levels
such as year, quarter, and month. In addition, some multidimensional
data sources have time intelligence enabled, which makes it possible to look at data levels different
ways, such as Months by Year, Months
by Quarter, Weekends, etc. These levels are represented as attributes of
the hierarchy. Hierarchies and attributes are defined when
the cube is created and you cannot modify them in Tableau. For example,
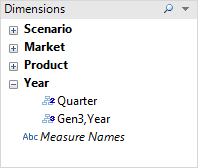
the Year dimension from an Oracle Essbase data source
is shown below.
When you place a multidimensional date on a shelf, the field is treated like any other dimension. For example, you can drill down, drill up, and so on.
Dates in Relational Data Sources
For relational data sources, dates and times are automatically placed in the Dimensions area of the Data window and are identified by the date or date-time
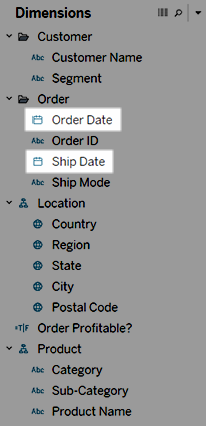
  icon. For example, the Order
Date and Ship Date dimensions
from an Excel data source are shown below.
When you place a relational date on a shelf, the field name is automatically modified to reflect the default date level. Tableau defines the default date level to be the level at which there are multiple instances. For example, if the date field includes multiple years, the default level is year. However, if the date field contains data for just one year but includes multiple months, then the default level is month.
If you don’t want Tableau to automatically select a date level and would rather have a date dimension be a continuous field, you can right-click the field in the Data window and select Convert to Continuous. The dimension then turns green in the Data window; now when you use that dimension in a view, it will be continuous. You can easily revert back by selecting Convert to Discrete from the field’s context menu in the Data window. You can also convert a field in the view to continuous while it is on a shelf by selecting Continuous on its context menu (which you can see when you right-click the field). The field on the shelf turns green but the field in the Data window is still discrete.
- Date Properties
- Changing Date Levels
- Custom Dates
- Fiscal Dates
- Perfect Pivoting with Dates
- Continuous Dates
No comments:
Post a Comment