Basic Reference Distributions
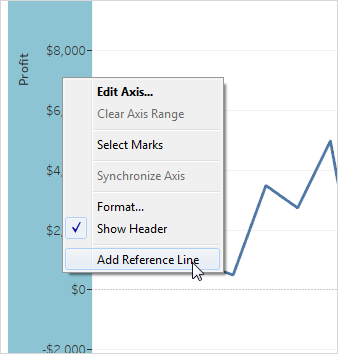
To add a reference distribution:
-
Right-click on a quantitative axis and select Add Reference
Line, Band, or Box.
-
In the Add Reference Line, Band, or Box dialog box, select Distribution.

-
Select one of the following scopes:

-
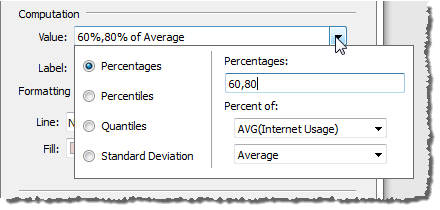
Select the distribution values. You can select from the following
options:
-
Confidence Interval - shades the interval
between which lie the specified percentage of values.
-
Percentages - shades the interval between which lie
specified percentages of values. Separate multiple percentage values
with a comma (for example,
60, 80).
-
Percentiles - shades intervals at
the specified percentiles. When you select this option, you must also
specify one or more numerical values. You will not actually see any
shading unless you specify at least two values (for example,
60,80).
-
Quantiles - breaks the view into
the specified number
of tiles using shading and lines. When you select this computation,
you must also specify the number of tiles (from 3 to 10, inclusive). For
example, if you select 3, Tableau calculates the boundaries between the
first, second and third terciles by calling the general quantile
function and asking for the 33.33 and the 66.66 quantiles. It then
shades the three terciles differently.
Tableau uses estimation type 7 in the R standard to compute quantiles and percentiles. For further details, see Quantile (external link to wikipedia page, in English).
-
Standard Deviation - places lines and shading to indicated
the specified number of standard deviations above and below the
mean. When you select this option you must specify the factor, which
is the number of standard deviations and whether the computation
is on a sample or the population.
-
Specify formatting options. You can format the lines (for example,
style, thickness, and color) as well as the fill gradient. Select
from a list of predefined gradients. Select Reverse to change the
order of shading in the gradient and Symmetric to use a single color instead
of a gradient. You can also specify whether to add additional shading
above and below the defined distribution.

This comment has been removed by the author.
ReplyDeleteThanks for Sharing nice information Tableau Online Training in hyderabad
ReplyDeleteI have read your blog its very attractive and impressive. I like your blog
ReplyDeleteHadoop Training In Hyderabad
Tableau Training In hyderabad