In Tableau, you typically create text tables (also called cross-tabs or pivot tables) by placing one dimension on the Rows shelf and another dimension on the Columns shelf. You then complete the view by dragging one or more measures to Text on the Marks card.
A text table uses the text mark type. Tableau chooses this mark type automatically if the view is constructed using only dimensions (assuming the Mark type is set to Automatic).
The following exercise walks you through creating a text table that shows sales totals by year and category.
- Connect to the Sample - Superstore - English (Extract) data source, which is included with Tableau Desktop.
-
Drag the Order Date dimension
to Columns.
The date is automatically aggregated by year, and column headers are created.
-
Drag the Category dimension to Rows.
Row headers are created. Columns with headers plus rows with headers means that a valid table structure now exists. You must now add a measure to the view to see actual data (that is, numbers).
-
Drag the Sales measure to Text on the Marks card.
The measure is automatically aggregated as a sum. The resulting view looks like this:
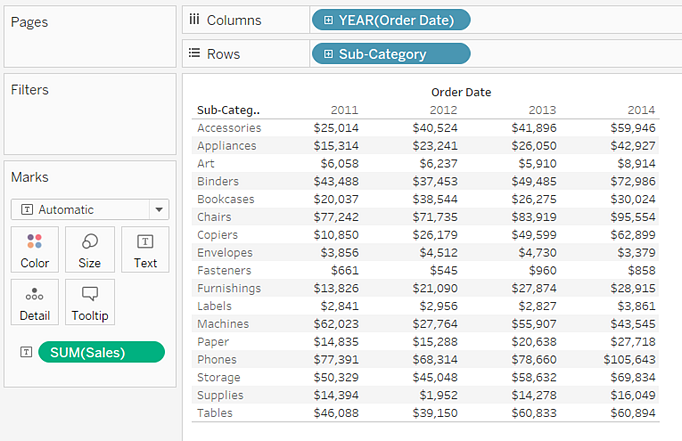
Tableau automatically uses text as the mark type. Each cell in the table displays the sum of the sales for a particular year and category.
We can see that Office Machines had the highest sales in every year but one.
-
Drag the Continent dimension to Rows and drop it to the left of Category. Do this by positioning Continent to the left of Category until you see a small triangle indicating that the new field will be inserted to the left of the existing field:
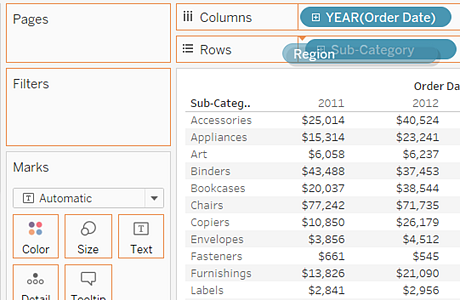
The view updates to break out sales by continent, in addition to year and category:
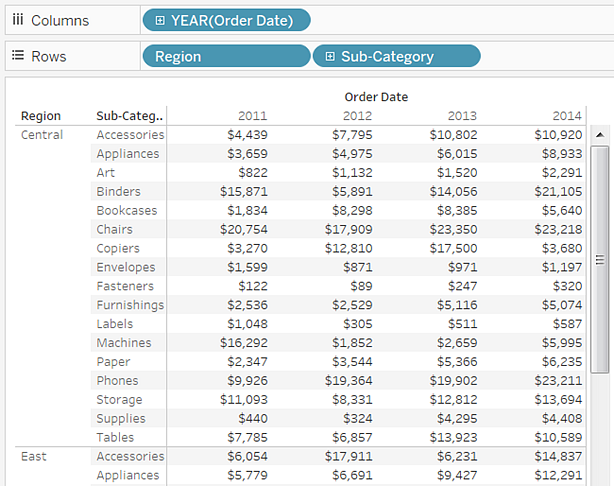
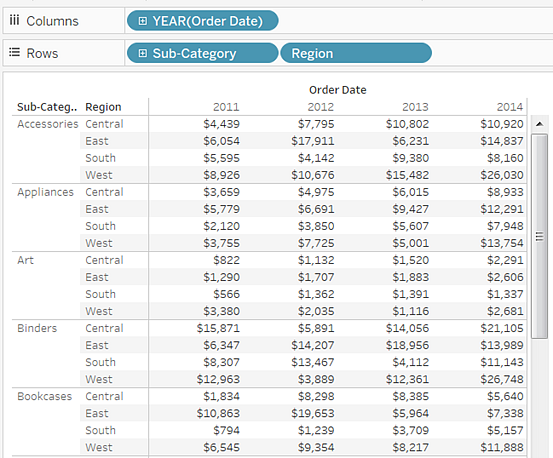
Continents are listed alphabetically, with Africa first. If you'd dropped Continent to the right of Category, the view would have been organized first by category, and then by continent:
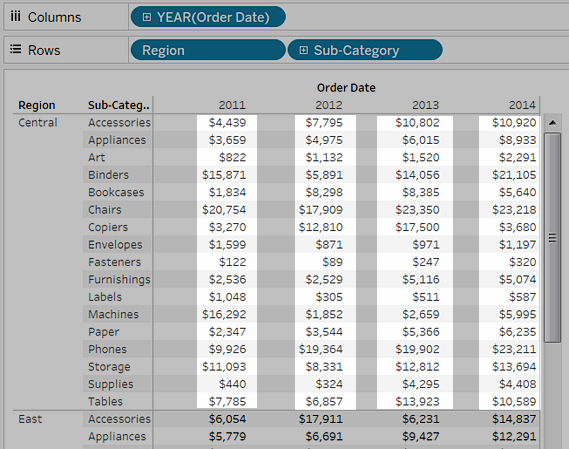
You can use a table calculation to show percentages of total instead of raw dollar values. The key question with a table calculation is how to frame the calculation--the more dimensions in your view, the more complicated this question can become. In the current case there are three dimensions in the view—Order Date, Category, and Continent. You could show percentages of total for a single dimension, but that can be unwieldy. For example, if you show percentages just by continent, the percentages would be calculated across the two remaining dimensions: Category (there are 17 categories) and Year(Order Date) (there are 4 years). So you would be dividing the total 17 x 4 = 68 ways. That would make for some tiny percentages. What might be useful is to show percentages using two dimensions: Year(Order Date) and Continent. Then the percentages would be calculated on the remaining dimension: Category. To put that in visual terms, you would be calculating percent of total within each red box in the following image:
The dimensions that you use to frame your calculation are called the addressing fields, and the fields (in this case a single field) in which you run your calculation are the partition fields. For more on these concepts, see Addressing and Partitioning.
-
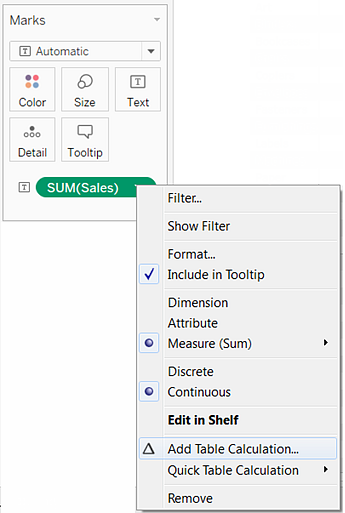
To create a table calculation to show percentages, right-click the SUM(Sales) field on the Marks card, and then choose Add Table Calculation:
-
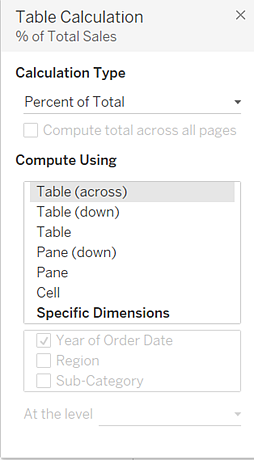
In the Table Calculation dialog box, set Calculation Type to Percent of Total.
The options in the dialog box change depending on the type of calculation you choose:
For more information on the options in the Table Calculation dialog box, see Using Table Calculations in the Tableau knowledge base.
-
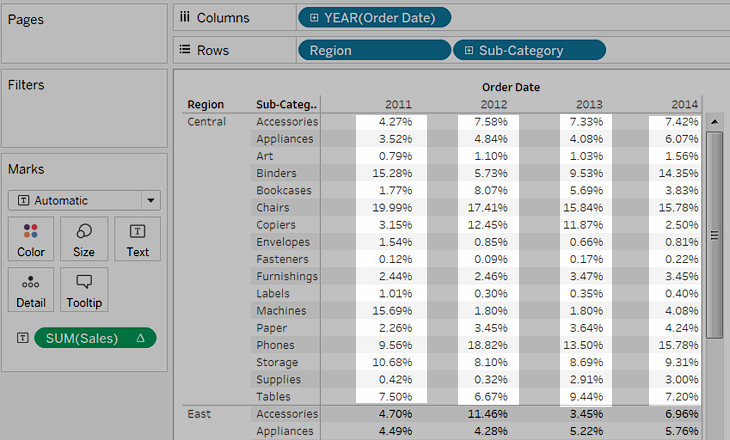
Choose Pane (Down), and then click OK to close the Table Calculation dialog box.
Now we see percentages calculated within each category, duplicated for each year within each continent. The numbers within each red box add up to 100%:
Pane (Down) is the correct choice because it specifies that the calculation should be performed from top to bottom within each pane of the table. The table has two vertical dimensions, so Table (Down) would have calculated the percent of total from top to bottom for the entire table, ignoring the Continent dimension. The pane is always the finest level of detail for the relevant direction (across or down). If you had three dimensions on the vertical axis, you might have had to use field names to define the calculation, since only the dimension furthest to the left on the Rows shelf (defined as Table) and the dimension furthest to the right (defined as Pane) could be captured with the structural options.
If you find these concepts daunting, you're not alone. It's not inappropriate to use trial-and-error to see the results of different definitions for table calculations. But you should have a clear idea of what result you want, so that you can recognize it when you see it.
Hi friend iam providing theTableau training in hyderabad various cretification training.
ReplyDeleteThanks For Sharing Tableau Training in Hyderabad for more details visit a1trainings
ReplyDeleteThis comment has been removed by the author.
ReplyDelete