There are many ways you can use sets to answer complex questions and compare cohorts of data. Below are some examples of ways you can use sets to define and compare subsets of data.
How do members of a set contribute to the total?
You may have all kinds of questions surrounding how the members in a set contribute to the overall total. For example, what percent of total sales come from repeat customers? You can answer these types of questions using the IN/OUT mode for set. The example below uses sales data to calculate the percent of total sales from customers who have purchased at least 20 times.-
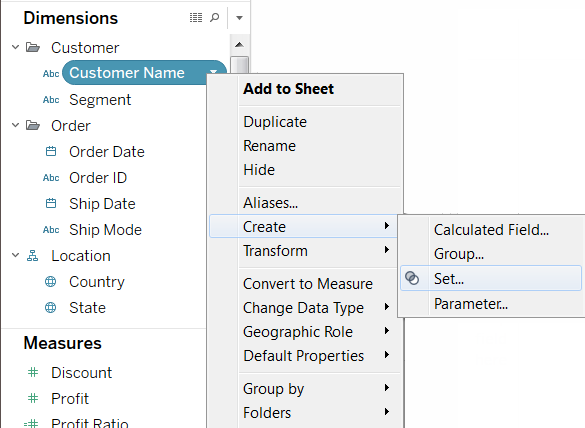
Right-click the Customer Name dimension in the Data window and select Create Set.
-
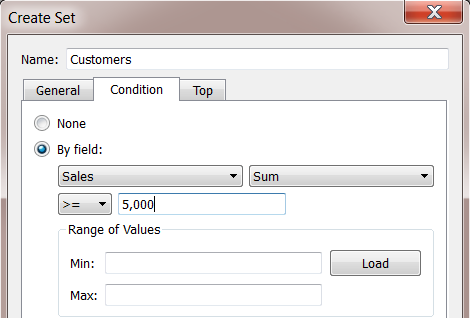
In the Create Set dialog box, type a name for the set. In this example, we'll call the set, "Frequent Customers"
-
Select the Use All option so the condition always applies to all values even when new customers are added.

-
On the Condition tab, select By Field and define a condition that only includes customers when Count (Distinct) of Order ID is greater than or equal to 20.
-
When finished, click OK.
-
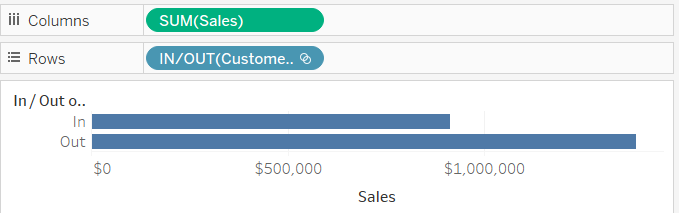
Drag the new set from the Sets area at the bottom of the Data window to the Rows shelf.
-
Drag the Sales
measure to the Columns shelf. The view now shows the total sales for
frequent customers and total sales for all other customers.
-
Finally, on the field menu for Sales, select Quick Table Calculation > Percent of Total.


How many members of a set exist in another set?
Another common use of sets is to compare subsets of data or cohorts. For example, you may wonder how many customers that purchased last year also purchased this year. Or if a customer purchased a specific product, what other products did they buy? You can answer these types of questions by creating multiple sets and combining them. The example below uses sales data to determine how many customers that purchased in 2010 also purchased in 2011.-
Drag the Customer Name field to the Rows shelf.
-
Drag the Order Date field to the Filters shelf.
-
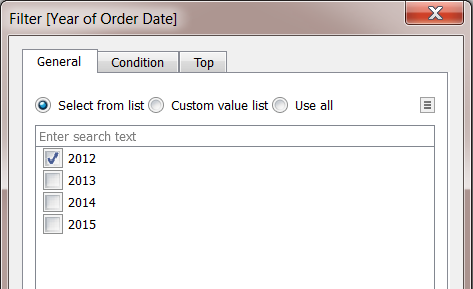
In the Filter Field dialog box, select Years and click Next.

-
In the Filter dialog box, select 2010 and click OK.
-
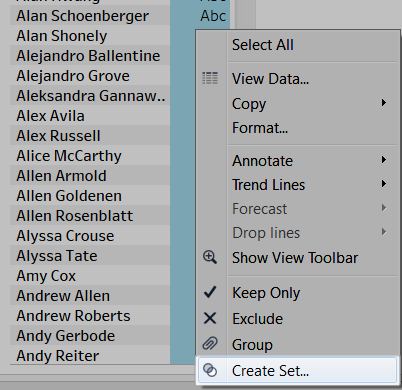
Back in the view, press CTRL + A on your keyboard to select all of the customers.
-
Right-click the selection and select Create Set.
-
In the Create Set dialog box, type a name for the set. In this example, we'll call the set "Customers (2010)".

-
When finished, click OK.
-
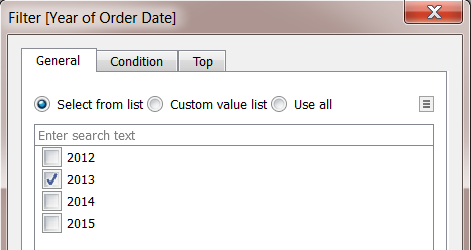
On the field menu for the Order Date field on the Filters shelf, select Filter.

-
Change the filter to only include 2011 instead of 2010. Then click OK.
-
Again, press CTRL + A on your keyboard to select all of the customers.
-
Right-click the selection and select Create Set.
-
In the Create set dialog box, type a name for the set. This set will be called "Customers (2011)".

-
When finished, click OK.
-
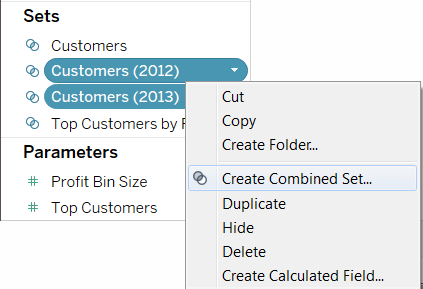
Hold the CTRL key on your keyboard to select both the Customers (2010) set and the Customers (2011) set in the Data window.
-
Right-click the selection and select Create Combined Set.
-
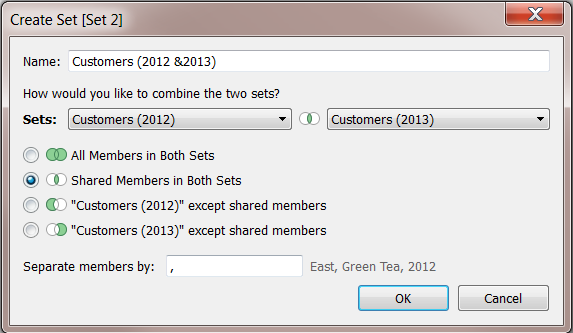
In the Create Set dialog box, type a name for the new set. In this example, we'll call the set "Customers (2010 & 2011)".
-
Make sure the correct two sets are selected in the drop-down menus.
-
Select the option to include Shared Members in Both Sets.
-
When finished, click OK.
-
Create a new sheet by clicking the New Worksheet tab at the bottom of the workbook.

-
Drag Customer Name to the Rows shelf.
-
On the Customer Name field menu, select Measure > Count (Distinct).
-
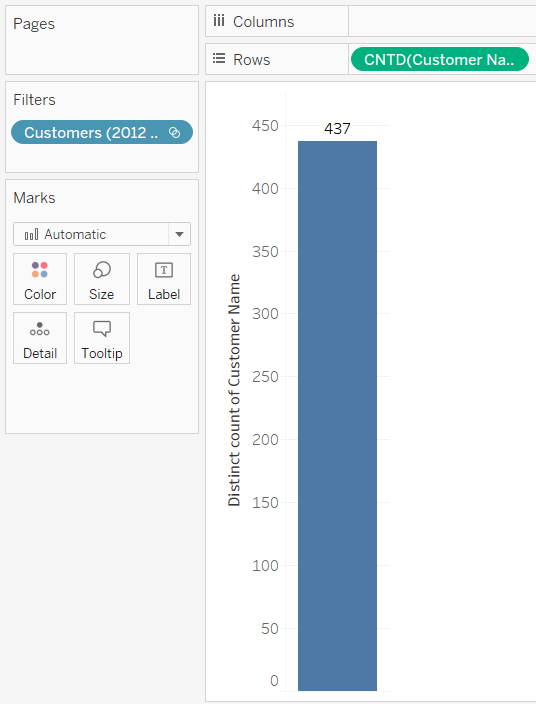
Finally, drag the Customers (2010 & 2011) field to the Filters shelf. You can see that 511 customers who purchased in both 2010 and 2011.
Hierarchical Sets and Descendants
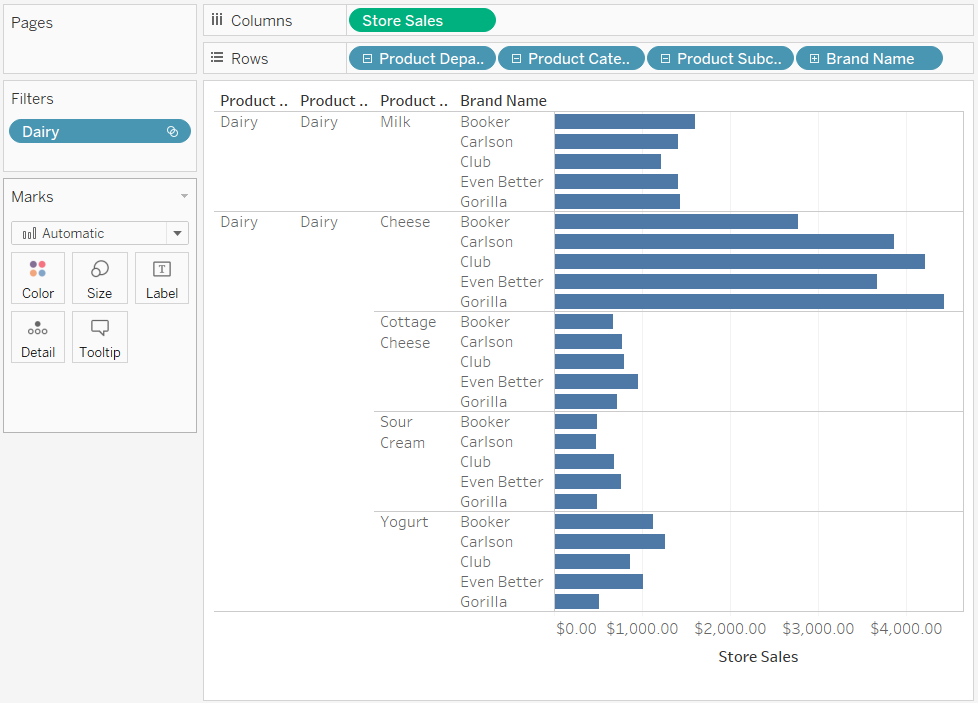
A hierarchical set filters data to the selected members and all of their descendants. For example, a set named Dairy is created from the Product hierarchy. As shown below, it includes only the Dairy product department.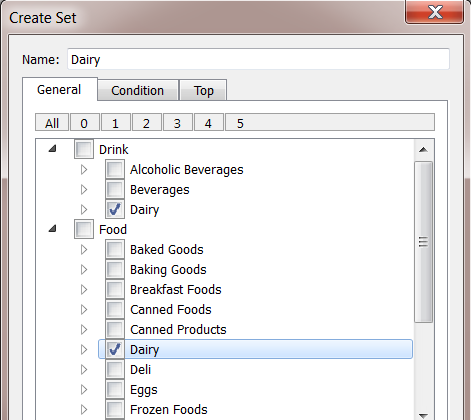
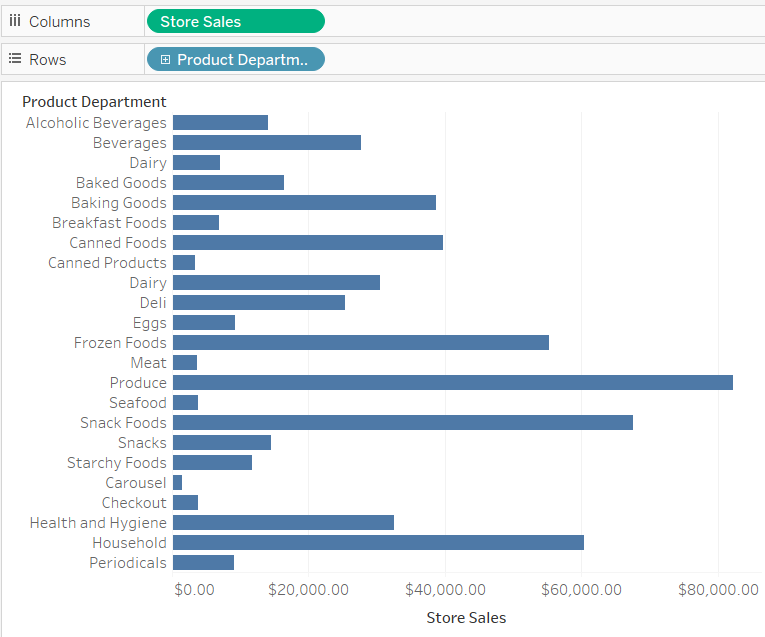
Consider the following view. The Product Category dimension is placed on the Rows shelf and the Store Sales measure is placed on the Columns shelf.
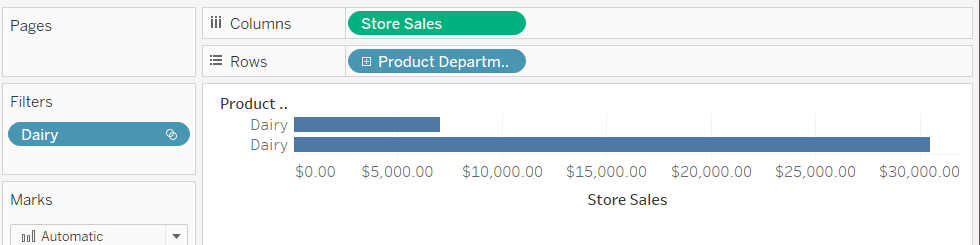
If you place the Dairy set on the Filters shelf, you can see that the view is filtered to include only the Dairy product categories.
As shown below, you can drill down into Product Department to reveal the Product Category, Product Subcategory, and Brand Name levels. As these descendants are revealed, row headers are added to the view. This is because a set filter allows you to view the levels of detail contained within the filtered members.
I am reading your post from the beginning, it was so interesting to read & I feel thanks to you for posting such a good blog, keep updates regularly.
ReplyDeleteTableau Online Training|
SAS Online Training
R Programming Online Training|
This comment has been removed by the author.
ReplyDeleteThis comment has been removed by the author.
ReplyDeleteThis post gave me a lot to think about. Thanks for presenting the topic with such depth.”
ReplyDelete“You’ve clearly done your research, and it shows. Looking forward to more posts like this!”
“I always learn something new from your blog—please keep writing!”
Instagram video download